Don’t bury yourself under a mountain of spreadsheets, systems, and databases. Why bother with the headache? Intuitive pulls in your PaperCut data and displays it in an organized, easy-to-digest, and elegant dashboard. With powerful, customized filtering options, you’ll see your data like you never have before – the way you want it. That’s business intelligence.
INTRODUCING
Advanced Insights and Analytics for PaperCut Data
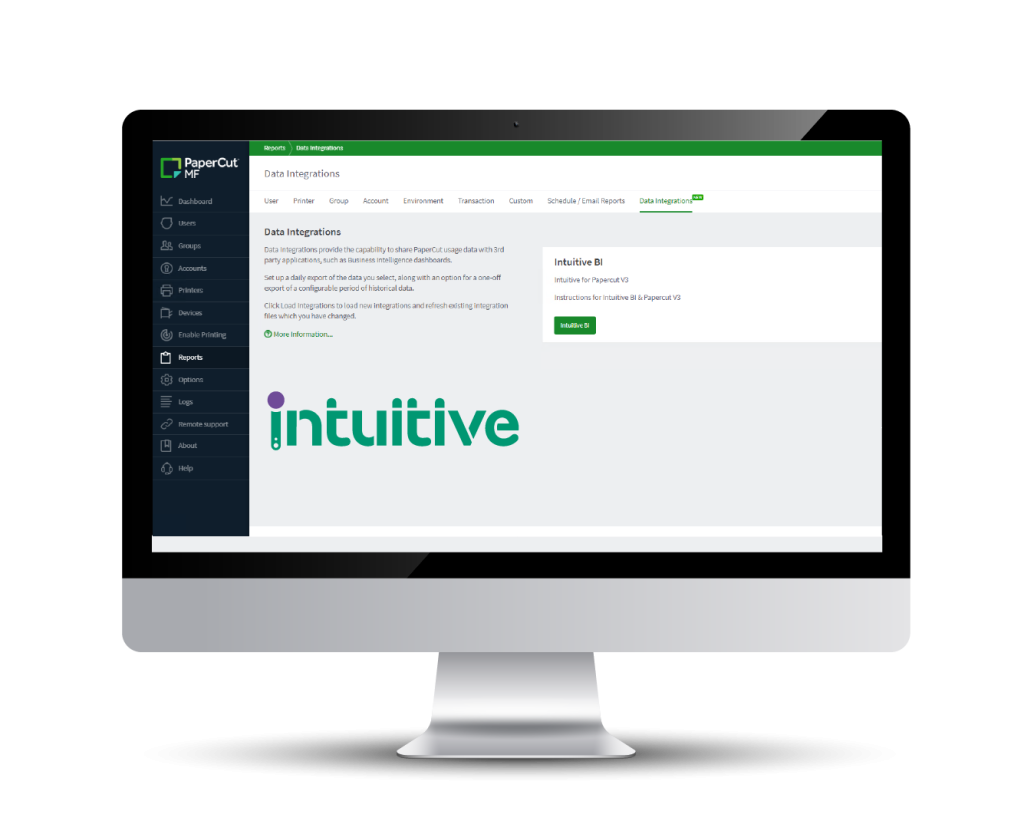
All the Intuitive analytics and insights designed specifically for the best print management software in the land, PaperCut. Launch Intuitive directly from the Integrations tab inside of the PaperCut 20 dashboard. No need setup those PaperCut reports. Intuitive gives you instant, real-time visualizations of your PaperCut installation. With infinite ways to click and drill-down in your data, the advanced comparison and benchmarking analytics will tell you the real story. Set up Intuitive for individual customers and rock your next QBR! Oh, and in true PaperCut fashion, an environmental dashboard based on user habits. Very earthy!
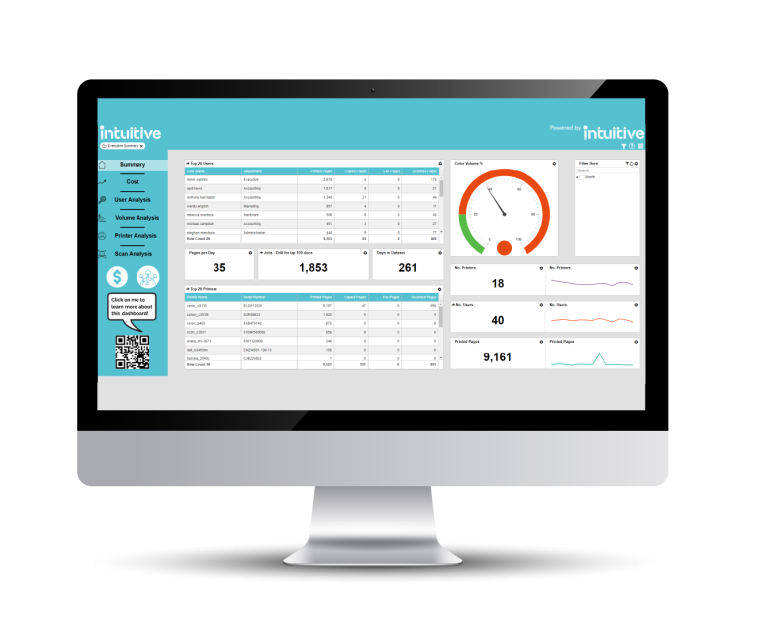
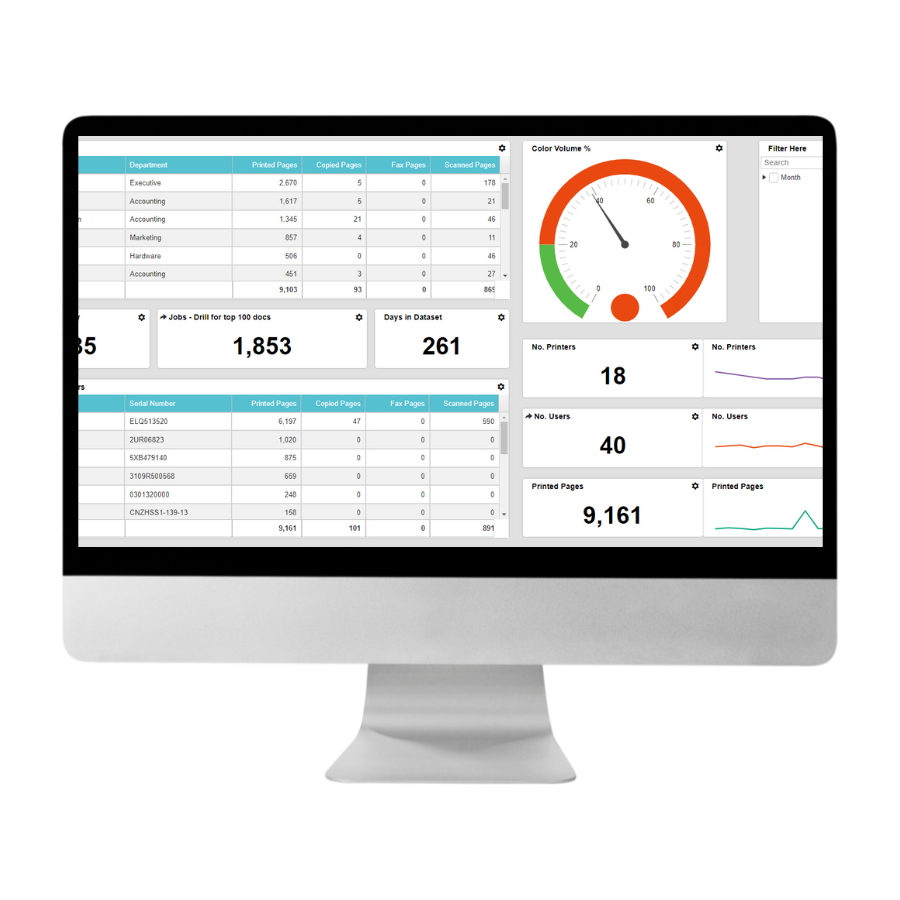
Multiple Intuitive views including by users, by devices, environmental, and summary Intuitive .
Quick-glance metrics at the top of your dashboard for ease of use.
Multiple data styles for better visualization.
Simply click to drill down or filter by any available metric.
View reports based on the custom date range you set.
We know it’s a lot to take in all at once and that questions are inevitable. Please reach out – we love talking about how our solutions will streamline your business processes regarding security, cost savings, accountability, accessibility, analytics, and more.